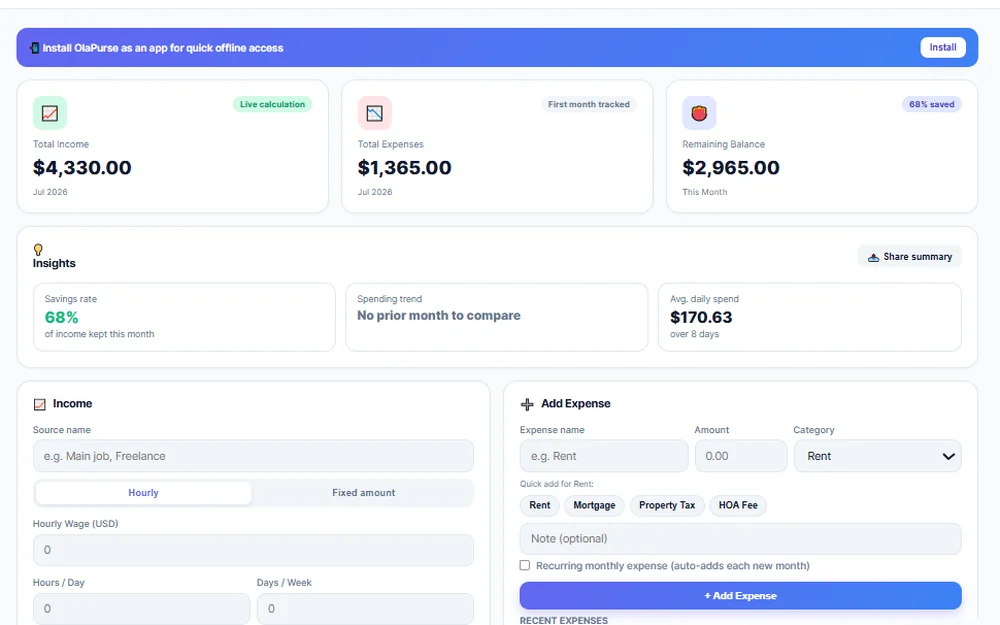

OlaPurse
Honor Your MoneyBudgeting and money tracking that stays on your device — built so your financial data is yours by architecture, not by promise.
// data analyst · healthcare analytics · business & product · toronto, on
Data analyst with a Master of Professional Studies in Analytics (Co-op) from Northeastern University and 5+ years working with healthcare and public-health data. I specialize in data quality, reporting and BI — validating data, automating recurring reports and building dashboards people actually use.
// 01 · about
I'm a data analyst with a Master of Professional Studies in Analytics (Co-op) from Northeastern University, a B.Sc. in Computer Science, and 5+ years working with data in healthcare and public-health settings.
My focus is the work that makes analytics trustworthy: validating data, building quality-assurance processes, and turning large, complex datasets into clean reports and dashboards people actually use. I work hands-on in SQL, Python and R, build dashboards in Power BI and Tableau, and care as much about clear communication as about the analysis itself.
My background spans national HIV/AIDS program reporting, EMR data quality and telecom KPI analytics in Nigeria, plus graduate training in machine learning and predictive analytics in Toronto. Alongside that, I design, build and run my own software as the founder of AFOLAOLA — a privacy-first product studio with six live products — and handle the business side too: brand and positioning, launches, search visibility, pricing and billing setup. It keeps me close to what makes data useful: start from the decision someone needs to make, then make the data behind it trustworthy.
// 02 · toolkit
// 03 · experience
// 04 · products
AFOLAOLA is the privacy-first product studio I founded, built on one idea — Honor What Matters. Six products are live today, each on its own domain; two more are on the way. Visit afolaola.com ↗
Budgeting and money tracking that stays on your device — built so your financial data is yours by architecture, not by promise.
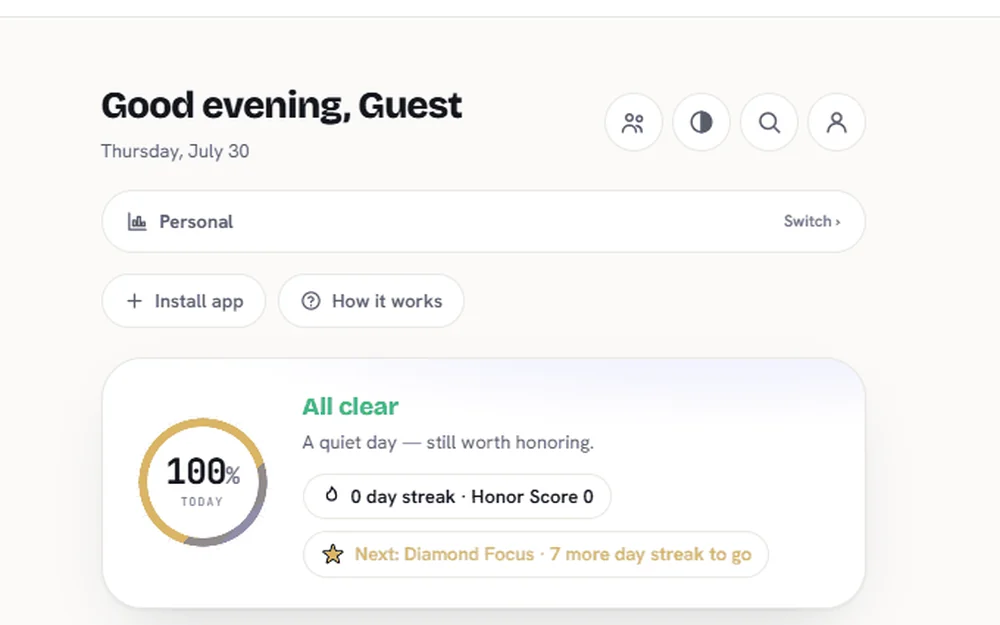
Scheduling and reliability tooling for clinics, campuses, and small teams — honest about progress, not just busy-looking.
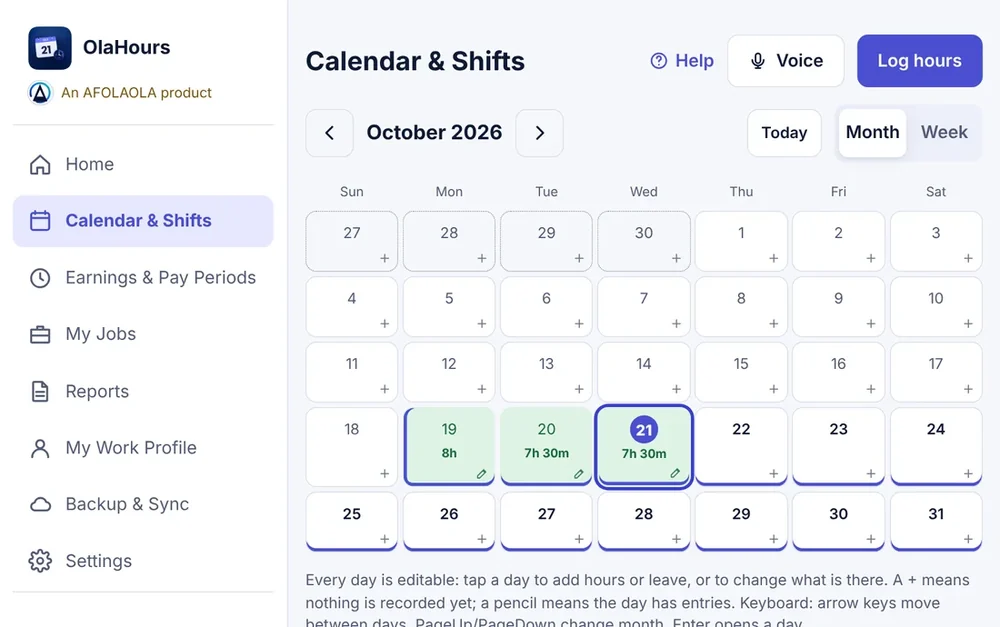
A branch of OlaPurse and OlaTime
Track the hours you work, follow your pay periods and keep your records — free, on your device, and always labeled as an estimate.
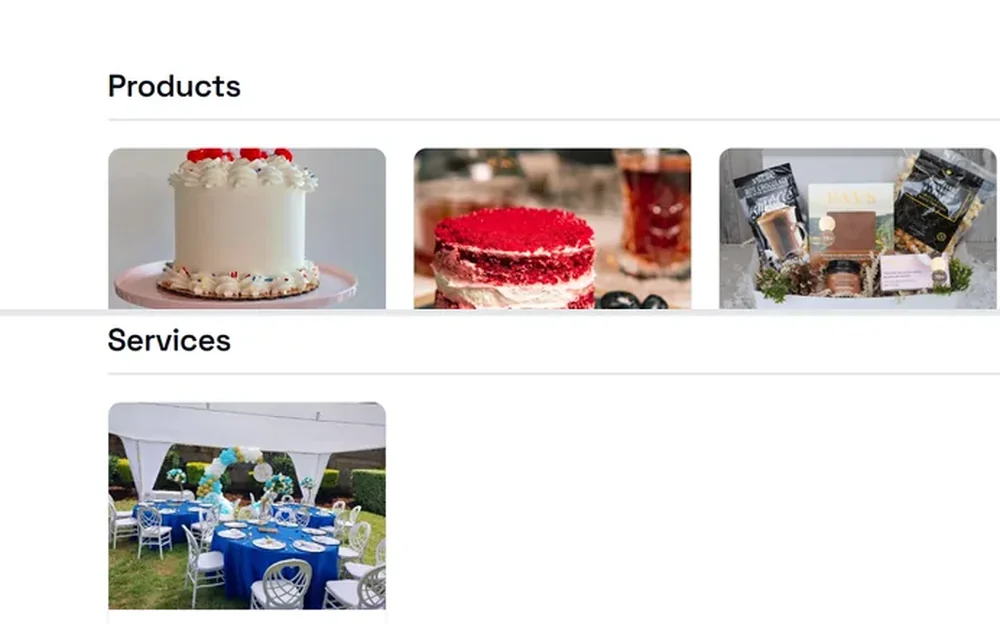
A privacy-first, no-code storefront for any seller: list products and services, take orders and message buyers directly, with no marketplace commission.
 Discover businesses. Find what you need. Visit the store.
A branch of OlaOrder
Public discovery for OlaOrder sellers: discover businesses, find what you need, then visit the store. Free to list; it never handles orders or payments.
 Connect. Control. Relax.
Your phone, your TV, one simple remote — free, with no ads and no account, and your remotes stay on your phone. Tested on a Roku TV; other brands are still being tested.
Screenshots are taken from each product's own landing page and show sample data.
// 05 · analytics projects
ACADEMIC healthcare ML · Streamlit · methods demo on proxy data
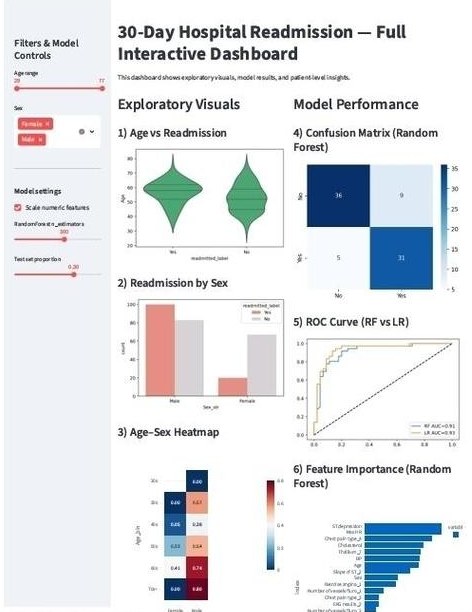
An end-to-end classification workflow built as a readmission-risk template. It compares Logistic Regression and Random Forest with full evaluation — ROC AUC, precision, recall, F1, confusion matrix and feature importance — and wraps the results in an interactive Streamlit dashboard where you filter by age and sex, tune model settings live and read per-patient risk scores.
The data, stated plainly: real readmission records are restricted patient data, so this uses a public heart-disease dataset as a stand-in outcome (the dashboard says so too). It demonstrates the workflow, not real readmission performance. ROC AUC was 0.93 (logistic regression) and 0.91 (random forest) on an 81-patient test set — small enough that I treat it as a workflow check, not a benchmark.
With real readmission data I would add: a time-based split and leakage review (no post-discharge fields), a simple baseline such as the LACE index to beat, calibration and a threshold chosen around the cost of a missed readmission, subgroup performance checks, and privacy sign-off under PHIPA.
public health · reporting · academic
Analyzed public-health datasets — HIV/AIDS trends (2007–2016) in R, COVID-19 case and vaccine dashboards in R and Power BI, and demographic health dashboards in Tableau — producing response curves, trend reports and visual summaries for stakeholder review.
forecasting · optimization · academic
Developed ARIMA time-series forecasts and an optimization model balancing holding costs against availability — reducing holding costs by 15% for a mid-sized manufacturer.
data quality · automation · from my role at APIN
Designed an automated Excel tool to validate, flag and consolidate data across multiple facilities — catching gaps and inconsistencies before reporting and reducing errors by 40%.
more academic projects · 2024–2025
// 06 · credentials